Articles

Article Tools
 View Full Text View Full Text |
 Abstract Abstract |
 Article as PDF Article as PDF |
 Print this Article Print this Article |
 Pubmed Pubmed |
 PMC PMC |
 PubReader PubReader |
 Export to Citation Export to Citation |
 Email Alerts Email Alerts |
 Open Access Open Access |
Share this article on :


Stats or Metrics
Article
Short Communication
Exp Neurobiol 2022; 31(6): 401-408
Published online December 31, 2022
https://doi.org/10.5607/en22022
© The Korean Society for Brain and Neural Sciences
Regional Comparison of Imaging Biomarkers in the Striatum between Early- and Late-onset Alzheimer’s Disease
Ji Eun Kim1,2†, Dong-Kyun Lee3†, Ji Hye Hwang1,4, Chan-Mi Kim1,5, Yeji Kim6, Jae-Hong Lee1, Jong-Min Lee3*, Jee Hoon Roh1,7,8* and Alzheimer’s Disease Neuroimaging Initiative (ADNI)
1Department of Neurology, Asan Medical Center, University of Ulsan College of Medicine, Seoul 05505, 2Department of Neurology, Inje University Ilsan Paik Hospital, Goyang 10380, 3Department of Biomedical Engineering, Hanyang University, Seoul 04763, 4Department of Neurology, Keimyung University Daegu Dongsan Hospital, Daegu 42601, Korea, 5Athinoula A. Martinos Center for Biomedical Imaging, Massachusetts General Hospital, Harvard Medical School, Charlestown, MA 02129, USA, 6Department of Artificial Intelligence, Hanyang University, Seoul 04763, 7Department of Biomedical Sciences and Department of Physiology, Korea University College of Medicine, Seoul 02841, 8Department of Neurology, Anam Hospital, Korea University College of Medicine, Seoul 02841, Korea
Correspondence to: *To whom correspondence should be addressed.
Jee Hoon Roh, TEL: 82-2-2286-1275, FAX: 82-2-474-4691
e-mail: alzheimer@naver.com
Jong-Min Lee, TEL: 82-2-2220-0697, FAX: 82-2-2296-5943
e-mail: ljm@hanyang.ac.kr
†These authors contributed equally to this article.
This is an Open Access article distributed under the terms of the Creative Commons Attribution Non-Commercial License (http://creativecommons.org/licenses/by-nc/4.0) which permits unrestricted non-commercial use, distribution, and reproduction in any medium, provided the original work is properly cited.
Abstract
Striatal changes in the pathogenesis of Alzheimer’s disease (AD) is not fully understood yet. We compared structural and functional image differences in the striatum between patients with early onset AD (EOAD) and late onset AD (LOAD) to investigate whether EOAD harbors autosomal dominant AD like imaging findings. The clinical, neuropsychological and neuroimaging biomarkers of 77 probable AD patients and 107 elderly subjects with normal cognition (NC) from the Alzheimer’s Disease Neuroimaging Initiative (ADNI)-2 dataset were analyzed. Enrolled each subject completed a 3-Tesla MRI, baseline 18F-FDG-PET, and baseline 18F-AV-45 (Florbetapir) amyloid PET studies. AD patients were divided into two groups based on the onset age of clinical symptoms (EOAD <65 yrs; LOAD ≥65 yrs). A standardized uptake value ratio of the striatum and subcortical structures was obtained from both amyloid and FDG-PET scans. Structural MR imaging analysis was conducted using a parametric boundary description protocol, SPHARM-PDM. Of the 77 AD patients, 18 were EOAD and 59 were LOAD. Except for age of symptom onset, there were no statistically significant differences between the groups in demographics and detailed neuropsychological test results. 18F-AV-45 amyloid PET showed marked β-amyloid accumulation in the bilateral caudate nucleus and left pallidum in the EOAD group. Intriguingly, the caudate nucleus and putamen showed maintained glucose metabolism in the EOAD group compared to the LOAD group. Our image findings in the striatum of EOAD patients suggest that sporadic EOAD may share some pathophysiological changes noted in autosomal dominant AD.
Graphical Abstract
Keywords: Alzheimer’s disease, Striatum, Biomarkers, Amyloid PET, Early onset Alzheimer’s disease, Late onset Alzheimer’s disease
INTRODUCTION
The striatum is a region of particular interest in autosomal dominant Alzheimer’s disease (AD) research with evidence of prominent and early amyloid accumulation. We investigated whether age of symptom onset in sporadic AD can affect the accumulation of amyloid beta and subsequent changes in the striatum by assessing structural and functional images of early onset AD (EOAD) and late onset AD (LOAD).
Patients with EOAD, arbitrarily distinguished from LOAD by age of onset before 65, are known to have more prominent visuospatial, executive and language deficits and extrapyramidal signs compared to LOAD patients [1]. If the disease severity is similar, neocortical atrophy can be more prominent in EOAD [2]. In addition, autopsy studies showed greater burden of neuritic plaques and neurofibrillary tangles in patients with EOAD compared to LOAD [3].
The striatum, a central hub of the frontal-subcortical circuits, is closely connected and oscillates with prefrontal cortical activity through cortical-striatal-thalamic-cortical circuits [4]. Emerging evidences from autosomal dominant AD (ADAD) studies strongly suggest that the striatum is one of the first sites having amyloid beta pathology in the brain [5]. Given the similar clinical characteristics of EOAD and ADAD, we hypothesized that initial pathological changes in sporadic EOAD might involve the striatum similar to those in ADAD. We investigated patterns of amyloid accumulation, glucose metabolism, and shape and volume changes in the striatum and subcortical structures in patients with EOAD and LOAD.
MATERIALS AND METHODS
Subjects
AD patients and normal controls from the Alzheimer’s Disease Neuroimaging Initiative (ADNI)-2 cohort, who completed a 3-Tesla MRI, baseline 18F-FDG-PET, and baseline 18F-AV-45 (Florbetapir) amyloid PET studies were enrolled. Initially, we selected 89 probable AD subjects from the ADNI-2 dataset and 12 cases were excluded due to failures in cortical surface modeling. Consequently, a total of 77 probable AD patients (18 EOAD and 59 LOAD) whose diagnosis did not change during the follow-up period were included for final analysis. Using the same enrollment criteria, a total of 107 cognitively normal elderly subjects who remained normal cognition at a 2-year follow-up were also enrolled from the ADNI-2 dataset. Among 107 cognitively normal elderly subjects, we only included MRI data using the same MRI scanner and the same imaging protocols (magnetization-prepared rapid gradient-echo protocol; sagittal acquisition, repetition time=3,000 ms, echo time=3.55 ms, inversion time=1,000 ms, flip angle=8°, voxel dimensions of 0.94×0.94×1.2 mm) for volume and shape analysis. Finally, 28 control subjects were excluded from volume and shape analyses due to usage of different MRI scanners. For 18F-FDG PET analysis,14 control subjects were excluded and 8 subjects were excluded from 18F-AV-45 amyloid PET analysis due to imaging processing errors.
Clinical and neuropsychological assessments
Baseline age, gender, age of symptom onset, duration of disease, handedness, education, vascular risk factors, including hypertension, alcohol and smoking, family history of dementia (only for parental history of dementia, not including sibling history; designated for not only AD but also other types of dementia), and APOE ε4 allele status were reviewed. All subjects underwent the MMSE (Mini-Mental State Examination). Global scales, including FAQ (Functional Activities Questionnaire), NPI (Neuropsychiatric Inventory), CDR (Clinical dementia rating), CDR-SOB (sum of boxes) and GDS (Geriatric Depression scale) were additionally conducted in AD groups. Detailed neuropsychological tests to assess frontal-executive domain (trail-making test A, B and category fluency test), memory domain (logical memory test, immediate and delayed), and language domain (Boston naming test-30) were conducted in AD groups.
Imaging processing
Detailed analysis methods for amyloid and FDG-PET scans have been previously described [2]. We performed volumetric and shape analysis of subcortical regions using the FSL-FIRST algorithm and spherical harmonic parameterization and sampling in a three-dimensional point distribution model (SPHARM-PDM) algorithm. Detailed methods for subcortical structure analyses are described in the following section.
Shape and volume analysis for subcortical structures
First, image segmentation processing of subcortical regions were performed using the FSL-FIRST module (part of FMRIB’s Software Library, version 5.0.0, http://fsl.fmrib.ox.ac.uk/fsl) [6]. FSL-FIRST uses a subcortical model comprising shape and intensity information. The model atlas is constructed from manually segmented images of 15 subcortical structures from 336 manually labeled T1-weighted MR images. The manual labels are modeled as a point distribution model. To fit the models, the Active Appearance Model in a Bayesian framework was performed. The Active Appearance Model relates intensity models to each other with a weighting matrix estimated from the training set. Fitting images to new images is done by minimizing the squared difference between the predicted intensities and the observed image intensities. All this processing was performed using the ‘run first all’ command.
Second, shape analysis processing of subcortical regions was performed using SPHARM-PDM [7, 8]. Shape approximation using the first-order spherical harmonic aligns subcortical ROI according to the structure’s main axes, whereas higher-order spherical harmonics refine the surface modeling. One randomly selected subject was defined as the target subject. Then, the alignment was performed by minimizing the mean squared difference between the distances from the target subject to another subjects. The distance was mapped as a feature on the sphere of the same spatial domain. Each vertex of the sphere contained the distance from the target subject to each of the other subject.
Statistical analysis
Statistical analyses were performed using Statistical Package for the Social Sciences (SPSS version 21.0, SPSS Inc., Chicago, IL, US). For analysis of demographic data, Student’s t-tests and one-way analysis of variance (ANOVA) were used to assess continuous variables with normal distribution. Chi-square tests and Fisher’s exact tests were used to assess categorical variables. The normal control group of the ADNI-2 fulfils the minimum age criteria of 65 for the study enrolment (https://www.alzheimers.gov/clinical-trials/alzheimers-disease-neuroimaging-initiative-2-adni2). Therefore, instead of separating the normal control participants into 2 groups, we used analysis of covariance (ANCOVA) controlling for age to compare the mean SUVR of subregions between the EOAD and LOAD groups. Two-tailed p<0.05 was considered statistically significant. Bonferroni corrections for multiple comparisons were used where appropriate.
RESULTS
Demographic and clinical characteristics
Detailed demographic and clinical characteristics are presented in Table 1. Age of onset in the EOAD group was 58.1±4.4 years and 72.3±5.6 years in the LOAD group. The frequency of the apolipoprotein ε4 (
PET findings in the striatum
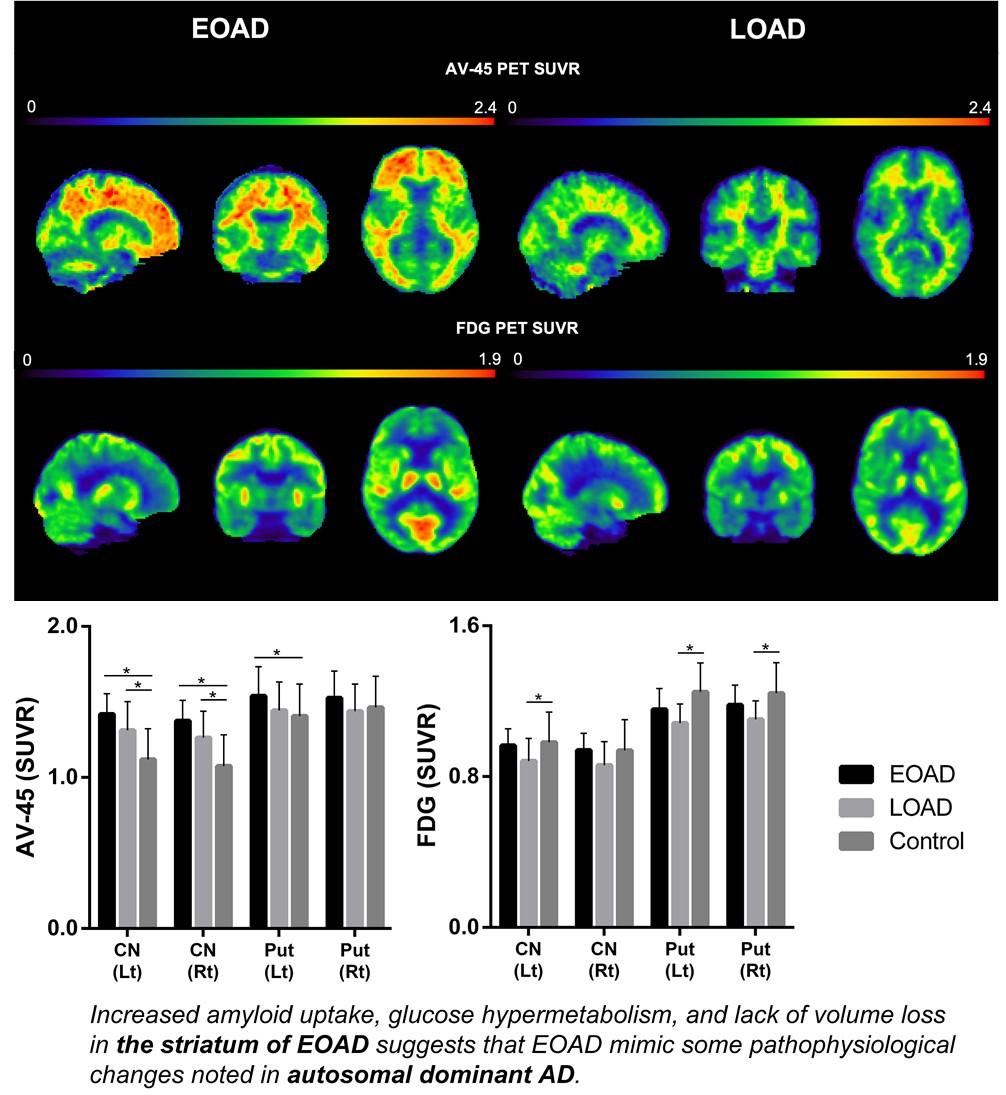
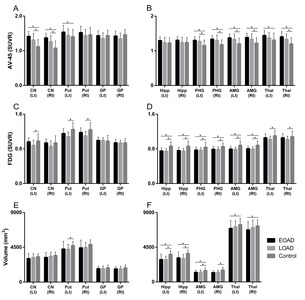
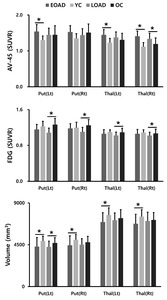
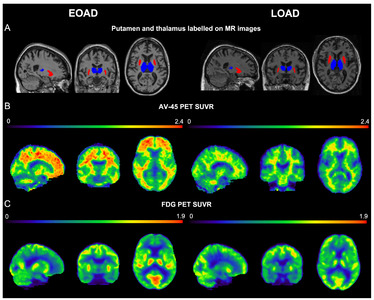
The EOAD group showed a greater degree of β-amyloid accumulation in all striatal subregions, including caudate nucleus and putamen compared to the LOAD group (Fig. 1A). Similar patterns were also found in other subcortical structures, such as parahippocampal gyrus, amygdala, and thalamus (Fig. 1B). Intriguingly, striatal glucose metabolism was more preserved in the EOAD group than in the LOAD group (Fig. 1C). This pattern was not found in other subcortical structures except for the thalamus (Fig. 1D). When the comparisons between young NC (YC) and EOAD and between old NC (OC) and LOAD were performed to reduce the effect of age on imaging biomarkers, similar patterns of functional changes were noted in the putamen. Amyloid uptake was more prominent in the left putamen of EOAD and glucose metabolism remained devoid of changes in putamen of EOAD compared to the YC (Fig. 2 A, B) as have been shown in the comparisons with the NC as a whole. PET images from representative patients showed increased amyloid uptakes and maintained glucose metabolism in the striatum and thalamus in EOAD compared to LOAD (Fig. 3).
Volume and shape analysis of the striatum
Compared to control subjects, volume reduction in the left putamen was noted in the LOAD group and reduction in the bilateral thalamus was shown in the EOAD group (Fig. 1E, F). When the comparisons between YC and EOAD and between OC and LOAD were performed, similar patterns of volume reduction in EOAD was shown in the putamen and thalamus (Fig. 2C).
DISCUSSION
We focused on patterns of imaging biomarker changes of subcortical structures in patients with sporadic EOAD. Similar to ADAD, more prominent β-amyloid deposition and relatively increased glucose metabolism in the striatum were observed in EOAD compared to LOAD. These findings were particularly significant in the putamen and less notable in pallidum, suggesting a sophisticated regional vulnerability. Recently, amyloid accumulation and preserved glucose metabolism in the striatum of ADAD patients were reported from the Dominantly Inherited Alzheimer Network cohort [9]. In contrast to the hypothetical models indicating glucose hypometabolism and volume reduction following amyloid beta accumulation, some subcortical regions, including the putamen and nucleus accumbens, showed preserved glucose metabolism and disproportionally increased amyloid uptake [9].
Intriguingly, the changes noted in the striatum of sporadic EOAD patients in this study were very similar to ADAD patients. These similarities are probably due to several potential mechanisms. First, regional glucose hypermetabolism in the striatum of EOAD can be explained by compensation to cope with regional amyloid accumulation. Activated microglia found within amyloid plaque, overproduction of inflammatory substances, excessive calcium entry into neurons, or effects from inappropriately hyperactive neurons in cortical circuits are regarded as potential mechanism of regional glucose hypermetabolism in the striatum [10]. Second, baseline levels of glucose metabolism might be higher in patients with EOAD. Aging process appears to increase the risk for deteriorating systemic glucose utilization, which in turn may diminish brain glucose uptake in LOAD rather than EOAD [11].
On the contrary, higher basal metabolism may have accelerated amyloid deposition. In line with default mode network theory, findings from mild cognitive impairment patients [12] and cognitively normal elderly subjects [13] showed that cortical regions that accumulate greater levels of amyloid correspond to functional hubs identified by increased functional connectivity with other brain regions. Based on these findings, one may assume that the striatum, linked by complex connections with various cortical and subcortical brain regions, may demonstrate increased metabolism consequently resulting in increased amyloid accumulation.
It is also notable that putamen and thalamus showed similar patterns of changes in amyloid accumulation, glucose metabolism, and volumetric change in EOAD. Cortical–striatal–thalamic–cortical loop circuits play a central role in cognitive function as a part of salience network. A bundle of connections originating from cortical neurons to striatal–thalamic circuits may have contributed to the compensatory responses of preserved glucose metabolism not noted in other subcortical structures [14]. Additionally, the regional microglial activation involved in AD pathogenesis might have contributed to the increased glucose uptake measured by FDG-PET along with inflammatory mediators. Given the vicious cycle of neuroinflammation resulted from bi-directional influence between the microglial activation and Aβ aggregation, there might be paradoxically preserved or increased glucose metabolism in the regions with active neuroinflammation and neuropathologic changes [15]. Although the changes in the striatum was highlighted in ADAD due to prominent amyloid deposition in the area from the early stages of the disease and specific pathologic findings – cotton wool plaques, emerging bodies of evidence suggest that ADAD individuals develop pathologies and atrophy in the thalamus as well as in the striatum [9, 16]. Regional changes in the striatum and thalamus of EOAD in our study potentially explain the similarities between EOAD and ADAD.
As noted in methods section, authors enrolled subjects with AD and normal cognition when the diagnosis of each subject did not change during the follow-up period for the best diagnostic accuracy of study participants. There are limitations that may have attributed to such enrollment process. First, the number of subjects enrolled was relatively small. Second, this is a cross-sectional study and a longitudinal replication will elucidate more putative trajectories in the striatum. Third, there was a lack of genetic assessment except for
Taken together, image findings in the striatum of EOAD patients in this study suggest that sporadic EOAD may share some pathophysiological changes noted in ADAD.
ACKNOWLEDGEMENTS
All data used in the preparation of this article were obtained from the Alzheimer’s Disease Neuroimaging Initiative (ADNI) database (http://adni.loni.usc.edu). A complete listing of ADNI investigators can be found at http://adni.loni.usc.edu/wpcontent/uploads/how_to_apply/ADNI_Acknowledgement_List.pdf. Data collection and sharing for this project was funded by the Alzheimer’s Disease Neuroimaging Initiative (ADNI) (National Institutes of Health Grant U01 AG024904) and DOD ADNI (Department of Defense award number W81XWH-12-2-0012). ADNI is funded by the National Institute on Aging, the National Institute of Biomedical Imaging and Bioengineering, and through generous contributions from the following : Alzheimer’s Association; Alzheimer’s Drug Discovery Foundation; Araclon Biotech; BioClinica, Inc.; Biogen Idec Inc.; Bristol-Myers Squibb Company; Eisai Inc.; Elan Pharmaceuticals, Inc.; Eli Lilly and Company; EuroImmun; F. Hoffmann-La Roche Ltd and its affiliated company Genentech, Inc.; Fujirebio; GE Healthcare; ; IXICOLtd.; Janssen Alzheimer Immunotherapy Research & Development, LLC.; Johnson & Johnson Pharmaceutical Research & Development LLC.; Medpace, Inc.; Merck & Co., Inc.; Meso Scale Diagnostics, LLC.; NeuroRx Research; Neurotrack Technologies; Novartis Pharmaceuticals Corporation; Pfizer Inc.; Piramal Imaging; Servier; Synarc Inc.; and Takeda Pharmaceutical Company. The Canadian Institutes of Health Research is providing funds to support ADNI clinical sites in Canada. Private sector contributions are facilitated by the Foundation for the National Institutes of Health (www.fnih.org). The grantee organization is the Northern California Institute for Research and Education, and the study is coordinated by the Alzheimer’s Disease Cooperative Study at the University of California, San Diego. ADNI data are disseminated by the Laboratory for Neuro Imaging at the University of Southern California.
The authors report no disclosures.
This study was supported by Korean National Research Foundation Grants (NRF-2021R1I1A1A01049566) and Grants from Korea University (K2123751, K2125871) and The Chung Yang, Cha Young Sun & Jang Hi Joo Memorial Fund and Medical Research Promotion Program through the Gangneung Asan Hospital funded by the Asan Foundation (2020IC002). This study was also supported by the Korea Health Technology R&D Project Grant (HU21C0066, HU22C0018) through the Kores Health Industry Development Institute (KHIDI) and Korea Dementia Research Center (KDRC), funded by the Ministry of Health & Welfare and Ministry of Science and ICT, Republic of Korea.
Figures
Tables
Demographic and clinical characteristics
| EOAD | LOAD | Control | p-value | |
|---|---|---|---|---|
| N (%) | 18 | 59 | 107 | |
| Sex | ||||
| Male (%) | 8 (44.4) | 35 (59.3) | 58 (54.2) | 0.527 |
| Female (%) | 10 (55.6) | 24 (40.7) | 49 (45.8) | |
| Baseline age | 63.5±6.3a,b | 76.8±5.1a | 73.3±6.4b | LOAD vs Control=0.052 |
| Onset age | 58.1±4.4 | 72.3±5.6 | N/A | <0.001 |
| Disease duration | 5.4±4.3 | 4.6±3.1 | N/A | 0.370 |
| Education | 15.8±2.2 | 16.0±2.6 | 16.8±2.5 | 0.069 |
| Handedness | ||||
| Right (%) | 16 (88.9) | 55 (93.2) | 97 (90.7) | 0.794 |
| Left (%) | 2 (11.1) | 4 (6.8) | 10 (9.3) | |
| ApoE4 genotype | ||||
| ≥1 allele (%) | 13 (72.2) | 42 (71.2) | 30 (28.0) | <0.001 |
| None (%) | 5 (27.8) | 17 (28.8) | 77 (72.0) | |
| Family history of dementia | ||||
| Yes (%) | 7 (38.9) | 26 (44.1) | 50 (46.7) | 0.059 |
| No (%) | 10 (55.6) | 25 (42.4) | 56 (52.3) | |
| Unsure (%) | 1 (5.6) | 8 (13.6) | 1 (0.9) | |
| Hypertension (%) | 7 (38.9) | 31 (52.5) | 49 (45.8) | 0.533 |
| Alcohol (%) | 1 (5.6) | 0 (0.0) | 6 (5.6) | 0.180 |
| Smoking (%) | 4 (22.2) | 23 (39.0) | 49 (45.8) | 0.155 |
| MMSE | 21.9±3.6b | 23.2±2.4c | 29.2±0.9b,c | EOAD vs LOAD=0.391 |
| CDR | 0.8±0.3 (0.5, 1) | 0.8±0.3 (0.5, 2) | N/A | 0.894 |
| CDR-SB | 5.4±4.3 | 4.6±3.1 | N/A | 0.777 |
| Logical memory, immediate | 3.7±2.3 | 4.8±2.9 | N/A | 0.175 |
| Logical memory, delayed | 1.1±2.2 | 1.9±2.0 | N/A | 0.164 |
| BNT-30 | 24.9±4.6 | 22.6±5.5 | N/A | 0.109 |
| Category fluency (animal) | 12.8±5.0 | 12.3±4.9 | N/A | 0.674 |
| TMT-A (time) | 15.8±2.2 | 16.0±2.6 | N/A | 0.844 |
| TMT-B (time) | 166.3±64.3 | 177.4±84.9 | N/A | 0.618 |
| FAQ total score | 13.7±7.9 | 12.3±6.5 | N/A | 0.472 |
| NPI total score | 6.4±7.3 | 6.8±8.8 | N/A | 0.867 |
| GDS | 1.6±0.9 | 1.4±1.3 | N/A | 0.617 |
MMSE, Mini-Mental State Examination; CDR, Clinical Dementia Rating; CDR-SB, CDR sum of boxes; BNT, Boston naming test; TMT, Trail-making Test; FAQ, Functional Activities Questionnaire; NPI, Neuropsychiatric Inventory; GDS, Geriatric Depression Scale.
ap<0.001 between EOAD versus LOAD; bp<0.001 between EOAD versus control; cp<0.001 between LOAD versus control.
References
- Seltzer B, Sherwin I (1983) A comparison of clinical features in early- and late-onset primary degenerative dementia. One entity or two?. Arch Neurol 40:143-146


- Hwang J, Kim CM, Jeon S, Lee JM, Hong YJ, Roh JH, Lee JH, Koh JY, Na DL; Alzheimer's Disease Neuroimaging Initiative (2015) Prediction of Alzheimer's disease pathophysiology based on cortical thickness patterns. Alzheimers Dement (Amst) 2:58-67

- Marshall GA, Fairbanks LA, Tekin S, Vinters HV, Cummings JL (2007) Early-onset Alzheimer's disease is associated with greater pathologic burden. J Geriatr Psychiatry Neurol 20:29-33
- Sharott A, Moll CK, Engler G, Denker M, Grün S, Engel AK (2009) Different subtypes of striatal neurons are selectively modulated by cortical oscillations. J Neurosci 29:4571-4585
- Klunk WE, Price JC, Mathis CA, Tsopelas ND, Lopresti BJ, Ziolko SK, Bi W, Hoge JA, Cohen AD, Ikonomovic MD, Saxton JA, Snitz BE, Pollen DA, Moonis M, Lippa CF, Swearer JM, Johnson KA, Rentz DM, Fischman AJ, Aizenstein HJ, DeKosky ST (2007) Amyloid deposition begins in the striatum of presenilin-1 mutation carriers from two unrelated pedigrees. J Neurosci 27:6174-6184
- Patenaude B, Smith SM, Kennedy DN, Jenkinson M (2011) A Bayesian model of shape and appearance for subcortical brain segmentation. Neuroimage 56:907-922
- Styner M, Gerig G, Lieberman J, Jones D, Weinberger D (2003) Statistical shape analysis of neuroanatomical structures based on medial models. Med Image Anal 7:207-220
- Styner M, Oguz I, Xu S, Brechbühler C, Pantazis D, Levitt JJ, Shenton ME, Gerig G (2006) Framework for the statistical shape analysis of brain structures using SPHARM-PDM. Insight J 1071:242-250
- Benzinger TL, Blazey T, Jack CR Jr, Koeppe RA, Su Y, Xiong C, Raichle ME, Snyder AZ, Ances BM, Bateman RJ, Cairns NJ, Fagan AM, Goate A, Marcus DS, Aisen PS, Christensen JJ, Ercole L, Hornbeck RC, Farrar AM, Aldea P, Jasielec MS, Owen CJ, Xie X, Mayeux R, Brickman A, McDade E, Klunk W, Mathis CA, Ringman J, Thompson PM, Ghetti B, Saykin AJ, Sperling RA, Johnson KA, Salloway S, Correia S, Schofield PR, Masters CL, Rowe C, Villemagne VL, Martins R, Ourselin S, Rossor MN, Fox NC, Cash DM, Weiner MW, Holtzman DM, Buckles VD, Moulder K, Morris JC (2013) Regional variability of imaging biomarkers in autosomal dominant Alzheimer's disease. Proc Natl Acad Sci U S A 110:E4502-E4509
- Palop JJ, Mucke L (2010) Amyloid-beta-induced neuronal dysfunction in Alzheimer's disease: from synapses toward neural networks. Nat Neurosci 13:812-818
- Cunnane S, Nugent S, Roy M, Courchesne-Loyer A, Croteau E, Tremblay S, Castellano A, Pifferi F, Bocti C, Paquet N, Begdouri H, Bentourkia M, Turcotte E, Allard M, Barberger-Gateau P, Fulop T, Rapoport SI (2011) Brain fuel metabolism, aging, and Alzheimer's disease. Nutrition 27:3-20
- Cohen AD, Price JC, Weissfeld LA, James J, Rosario BL, Bi W, Nebes RD, Saxton JA, Snitz BE, Aizenstein HA, Wolk DA, Dekosky ST, Mathis CA, Klunk WE (2009) Basal cerebral metabolism may modulate the cognitive effects of Abeta in mild cognitive impairment: an example of brain reserve. J Neurosci 29:14770-14778
- Buckner RL, Sepulcre J, Talukdar T, Krienen FM, Liu H, Hedden T, Andrews-Hanna JR, Sperling RA, Johnson KA (2009) Cortical hubs revealed by intrinsic functional connectivity: mapping, assessment of stability, and relation to Alzheimer's disease. J Neurosci 29:1860-1873
- Peters SK, Dunlop K, Downar J (2016) Cortico-striatal-thalamic loop circuits of the salience network: a central pathway in psychiatric disease and treatment. Front Syst Neurosci 10:104
- Xiang X, Wind K, Wiedemann T, Blume T, Shi Y, Briel N, Beyer L, Biechele G, Eckenweber F, Zatcepin A, Lammich S, Ribicic S, Tahirovic S, Willem M, Deussing M, Palleis C, Rauchmann BS, Gildehaus FJ, Lindner S, Spitz C, Franzmeier N, Baumann K, Rominger A, Bartenstein P, Ziegler S, Drzezga A, Respondek G, Buerger K, Perneczky R, Levin J, Höglinger GU, Herms J, Haass C, Brendel M (2021) Microglial activation states drive glucose uptake and FDG-PET alterations in neurodegenerative diseases. Sci Transl Med 13:eabe5640
- Cash DM, Ridgway GR, Liang Y, Ryan NS, Kinnunen KM, Yeatman T, Malone IB, Benzinger TL, Jack CR Jr, Thompson PM, Ghetti BF, Saykin AJ, Masters CL, Ringman JM, Salloway SP, Schofield PR, Sperling RA, Cairns NJ, Marcus DS, Xiong C, Bateman RJ, Morris JC, Rossor MN, Ourselin S, Fox NC; Dominantly Inherited Alzheimer Network (2013) The pattern of atrophy in familial Alzheimer disease: volumetric MRI results from the DIAN study. Neurology 81:1425-1433